
Finding Red Flags and Opportunities in Your Google Analytics Data
As a marketer, understanding and utilizing your Google Analytics data is crucial to finding the right audience for your website. And while GA may seem daunting to newcomers, it’s actually much easier to navigate than you think!
Let’s take a look at three distinct reports within Google Analytics. You’ll discover how to easily find them, as well as how proper analysis of the data can improve conversions and help target the right website traffic.
Report 1: Behavior > Site Search > Usage
The first report we’ll take a look at can be found under Behavior > Site Search.
 When you’ve got the report up, we’re generally looking for two main observations:
- Are a very high or very low percentage of visits using site search? A high percentage here (40%+) could indicate that the website is difficult to use.
- Do sessions with search convert at a higher rate?
Let’s take a look at an example from one of our clients.
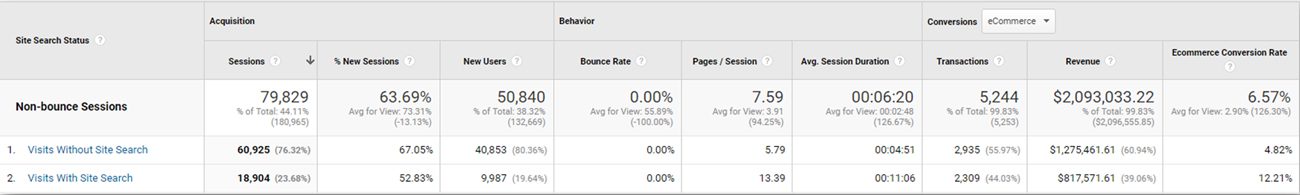 What we see here in this example:
- The majority of sessions (~76%) do not use site search, and they convert at 4.82%.
- ~24% of sessions do make use of site search, and they convert at 12.21%.
When comparing users who do / do not use site search, it’s important to use non-bounce sessions to get an apples-to-apples comparison and ensure you’re not artificially inflating the difference in conversion rate between those who do / do not use it. Otherwise, the conversion rate for Visits Without Site Search would be much lower because it would include all users who bounce.
CLIENT SUCCESS STORY
After analyzing this report for a client, our Conversion Optimization team tested the following hypothesis:
By increasing the visibility of the search bar and providing more detailed placeholder text, more users will use the site search feature, thereby increasing overall conversion rate.
The result? 15.5% higher conversion rate for the Variation!
 The result? 15.5% higher conversion rate for the Variation!
Report 2: Audience > Mobile > Overview
Next, let’s dive into device-specific data. The data for device type can be found under Audience > Mobile > Overview.
 This report is more straight-forward. We use it to identify the areas of greatest opportunity based on device type. This data is essential for determining where your traffic is coming from, and which devices are leading to your highest conversion rates and revenue generation.
Let’s take a look at an example report:
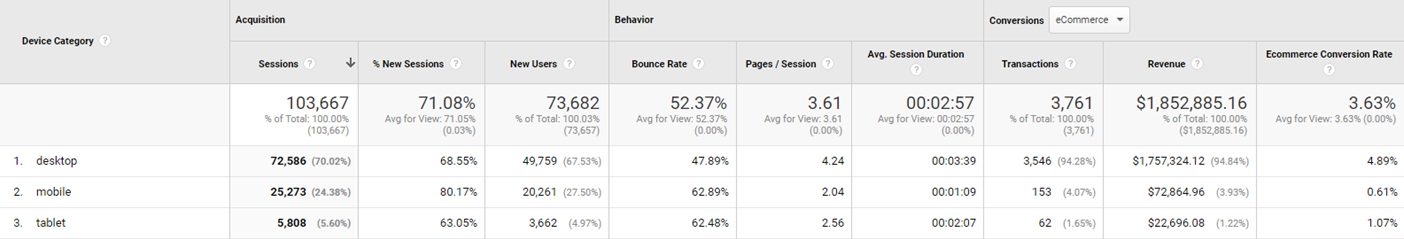 In this case, desktop leads the way with 70% of overall site traffic, followed by mobile with 24% of traffic and a low conversion rate.
If you’re interested in seeing the mobile trend over time, you can plot mobile on the chart and expand the date range over the past year to see if the amount of mobile traffic is increasing.
We’ll use this report to focus our efforts on the next report.
Report 3: Audience > Technology > Browser & OS
From the last example report, we learned that the greatest area of opportunity is desktop. Next, we’ll put on a desktop segment before looking at the Browser & OS Report. You could do the same for mobile traffic.
Generally speaking, browser differences are more pronounced on desktop, as seen in the example below. With this report, you want to look for the drop-off point in the percentage of sessions. This usually occurs after the top five browsers, as we see in this example.
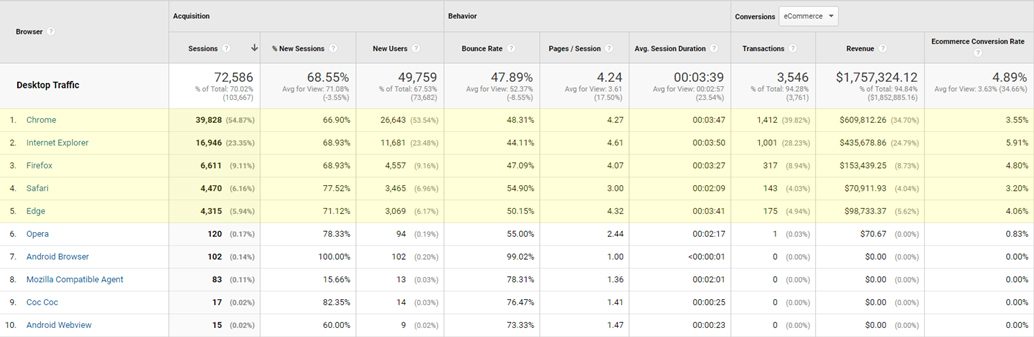 Compare conversion rates across these top five browsers, looking for any that stand out as performing significantly below the others.
Using the Comparison View is helpful to get a full picture on conversion rates across browsers.
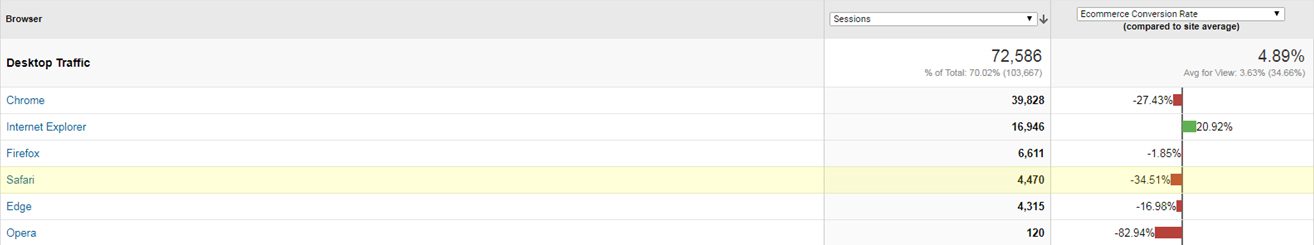 In this example, we can see that Chrome is down, but that’s not as concerning because we saw that Chrome users make up 55% of traffic and generally the higher trafficked browsers perform slightly worse.
From here we would want to dig into Safari. Generally speaking, Safari users tend to convert at higher rates for ecommerce conversions, so it’s unexpected for it to be down here.
Clicking into Safari displays the different versions.
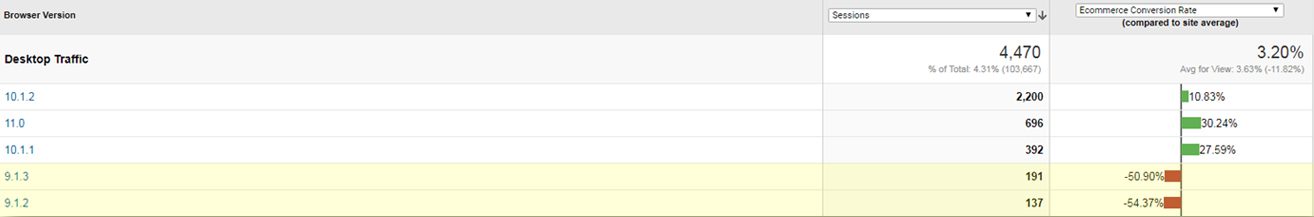 Here you could use a cross-browser testing tool, like BrowserStack, to do a site walkthrough on version 9.1.13 or 9.1.2. However, you need to be mindful of the development resources. If you find optimization opportunities on older versions with less traffic, that may not be worth spending development resources.
CLIENT SUCCESS STORY
Using these above reports, let’s take a look at a client-specific example.
In this specific situation, our client had recently gone through redesign of the checkout flow on their website. After implementation, our Conversion Optimization team noticed a sharp dip in Internet Explorer (IE) conversion rates. This dip was causing the client to lose tens of thousands of dollars in sales, which was an immediate red flag, as prior to the new checkout, IE had been a strong performer.
To determine what the issue was, the team performed a site walkthrough on IE, discovering that it was impossible to click into the form fields during the checkout process. Users who did manage to complete checkout here did it by tabbing through the fields.
Once our Conversion Optimization team alerted the client’s dev team to this issue and it was resolved, IE conversion rates returned to their previous rates.
This is a perfect example of how something like a change to checkout flow can have massive ramifications on overall revenue generation. This is why it is essential to consistently monitor these reports and look for outliers.
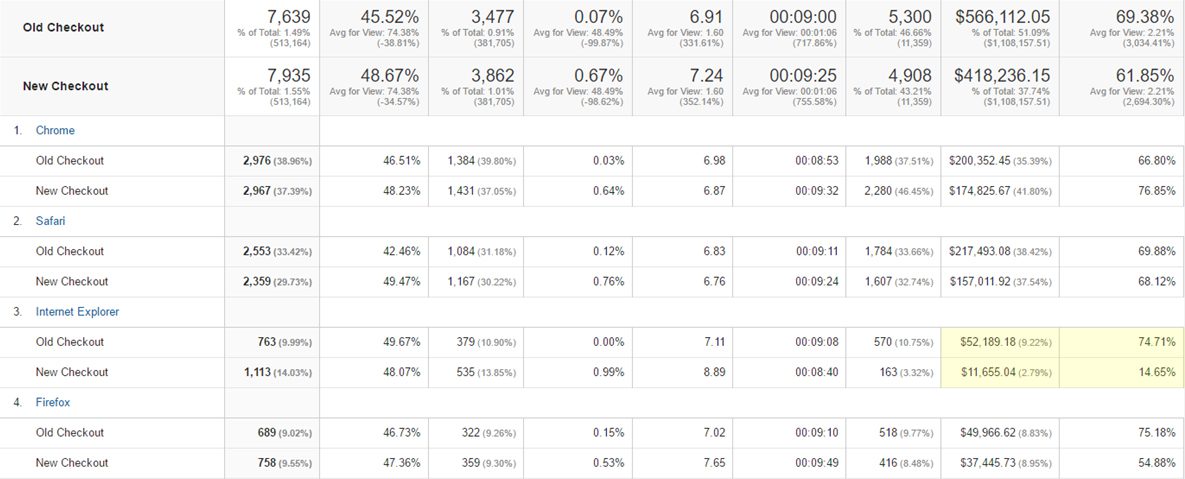 As you can see, the conversion rate didn’t just dip a little, it completely tanked, dropping more than 400%.
These three reports are just the tip of the iceberg. If you are truly looking to master conversion optimization, you’ll need to take a dedicated stance on analyzing, testing, and optimizing all aspects of your website.
If this seems a bit overwhelming, don’t worry! We’re here to help.
We’d like to offer you a complimentary, 20-minute conversion review where you’ll meet with our experts to uncover red flags and opportunities that are impacting your overall revenue and profitability. You’ll leave with actionable takeaways on how to further optimize your website for success.